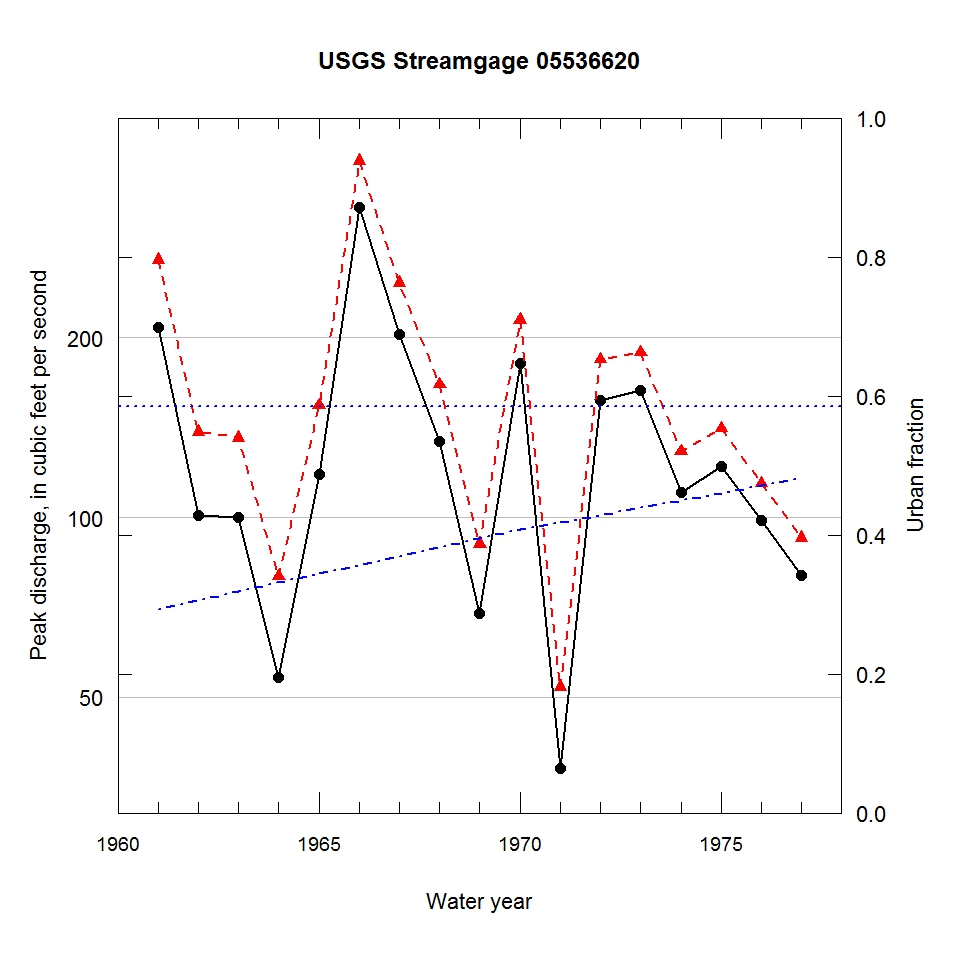
Observed and urbanization-adjusted annual maximum peak discharge and associated urban fraction and precipitation values at USGS streamgage:
05536620 MILL CREEK NEAR PALOS PARK, IL


| Water year | Segment | Discharge code | Cumulative reservoir storage (acre-feet) | Urban fraction | Precipitation (inches) | Observed peak discharge (ft3/s) | Adjusted peak discharge (ft3/s) | Exceedance probability |
| 1961 | 1 | -- | 0 | 0.293 | 1.419 | 208 | 270 | 0.098 |
| 1962 | 1 | -- | 0 | 0.306 | 0.281 | 101 | 139 | 0.563 |
| 1963 | 1 | -- | 0 | 0.319 | 1.531 | 100 | 136 | 0.583 |
| 1964 | 1 | -- | 0 | 0.331 | 0.734 | 54 | 80 | 0.891 |
| 1965 | 1 | -- | 0 | 0.344 | 0.884 | 118 | 154 | 0.473 |
| 1966 | 1 | -- | 0 | 0.357 | 1.424 | 330 | 395 | 0.027 |
| 1967 | 1 | -- | 0 | 0.370 | 1.152 | 203 | 247 | 0.138 |
| 1968 | 1 | 2 | 0 | 0.382 | 1.422 | 134 | 167 | 0.405 |
| 1969 | 1 | -- | 0 | 0.395 | 0.408 | 69 | 90 | 0.842 |
| 1970 | 1 | -- | 0 | 0.408 | 1.091 | 181 | 214 | 0.205 |
| 1971 | 1 | -- | 0 | 0.418 | 0.903 | 38 | 52 | 0.963 |
| 1972 | 1 | -- | 0 | 0.429 | 1.213 | 157 | 184 | 0.318 |
| 1973 | 1 | -- | 0 | 0.439 | 0.845 | 163 | 189 | 0.296 |
| 1974 | 1 | -- | 0 | 0.450 | 1.142 | 110 | 129 | 0.625 |
| 1975 | 1 | -- | 0 | 0.460 | 1.072 | 122 | 141 | 0.553 |
| 1976 | 1 | -- | 0 | 0.471 | 0.889 | 99 | 114 | 0.716 |
| 1977 | 1 | -- | 0 | 0.481 | 1.447 | 80 | 92 | 0.832 |

